Skip to content
Insights / Corporate Strategy

Understanding Through Seeing

How Visuals Support Decision-Making Processes
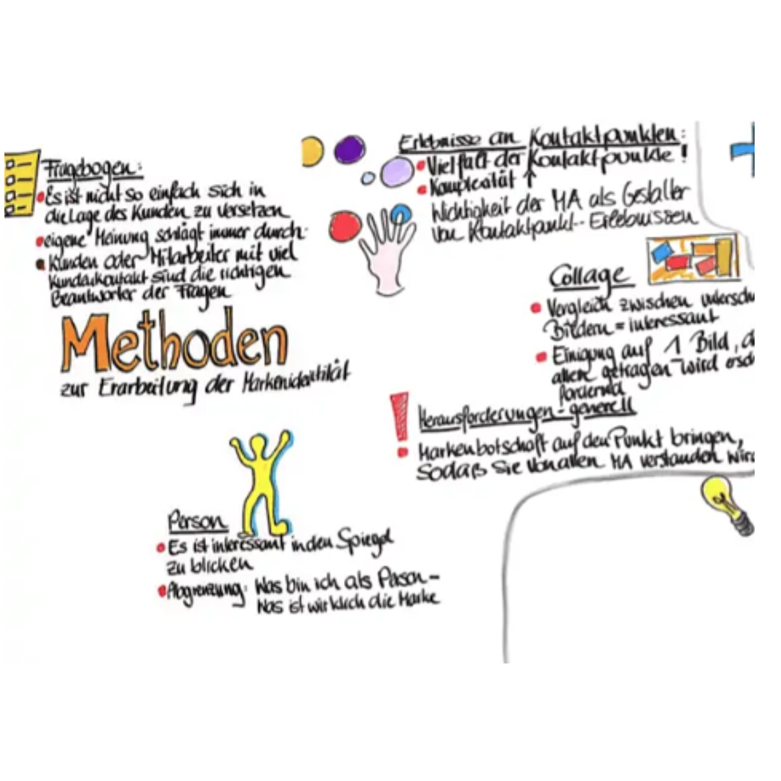
Handgezeichnete Sketchnote mit Methoden zur Erarbeitung der Markenidentität und kleinen farbigen Illustrationen.

Our language is full of imagery, and Vera Birkenbiehl demonstrated years ago: we learn better when we provide our brains with visuals.

Visualization has long been established in the world of training and workshops, but recently in increasingly elaborate forms. Often, graphic recorders are even hired to summarize discussions and decisions into true works of art. Visualization is trending—but what do these beautiful images actually achieve?

While we are not artists, we have explored various visualization methods in depth and tested them in workshops.

There are roughly two types of visualization used in workshops and seminars: graphic recording and visual facilitation.

In graphic recording, the core content of presentations and discussions is translated into symbols, simple drawings, and (as few as possible) words, then captured on large-format paper or projected using an iPad and projector. A graphic recorder typically does not intervene in the process but focuses on documenting the results.

In visual facilitation, documentation and moderation merge. The facilitator leads the workshop using visual aids, incorporates participants’ suggestions and ideas, and documents what happens in the room.

In our experience, interactive visual facilitation in particular has a very positive impact on both the process and the outcome:

Individual viewpoints within a group are aggregated into an overall picture. This creates a shared reality—not just in the minds of individuals, but as a physical “work” that participants can identify with.

Through the striking presentation, participants recognize connections and gaps, becoming aware of an unclear picture more quickly and being able to react to it.

Participants can better understand complex content and have a concrete anchor to reflect on and solidify their discussion results.

Large-format process documentation (in the form of a long sheet of paper that fills up as the workshop progresses) provides orientation: participants always have in view what has already been developed and which areas still need to be addressed.

Through visualization, decisions gain weight and participants feel heard. They remain focused and work with greater motivation.

Ideas take shape, and the playful nature of the presentation stimulates participants’ creativity and invites experimentation.

The visually appealing records help reinforce the results and often decorate the participants’ offices for a long time.

Visual facilitation has proven effective in a wide variety of workshop situations. We use the method in branding and strategy processes, in positioning, and for ideation workshops, and we are constantly amazed at how much more effective these processes become through the visuals developed by the participants.

Services
Brand Development Organization & Leadership Corporate Strategy Positionierung
To Service Overview
Eine freundlich lächelnde Frau mit blonden Haaren blickt direkt in die Kamera.
From Mag. Monika Heppner 10.05.2024

Articles you might be interested in

All Articles
13.10.2026

25 Years of IMARK – We Celebrated!

Dreidimensionaler Schriftzug Employer Branding als Würfel gestaltet mit kleinen roten Silhouetten.
05.09.2026

The Employer Brand in Daily Operations

Nahaufnahme eines Autoreifens auf einer sonnenbeschienenen Asphaltstraße bei Sonnenuntergang.
04.09.2026

SWARCO: From Corporate Brand to a Living Employer Brand

Modernes Explorer Hotel mit Holzfassade und grünen Akzenten vor einer bewaldeten Bergkulisse.
10.08.2026

Brand as a Management Tool – The Success Model of the Explorer Hotels

Farbenfroher Pixel-Art-Schriftzug BRAND OVER? vor einer klassischen Retro-Videospiel-Landschaft.
12.06.2026

Brand Over?

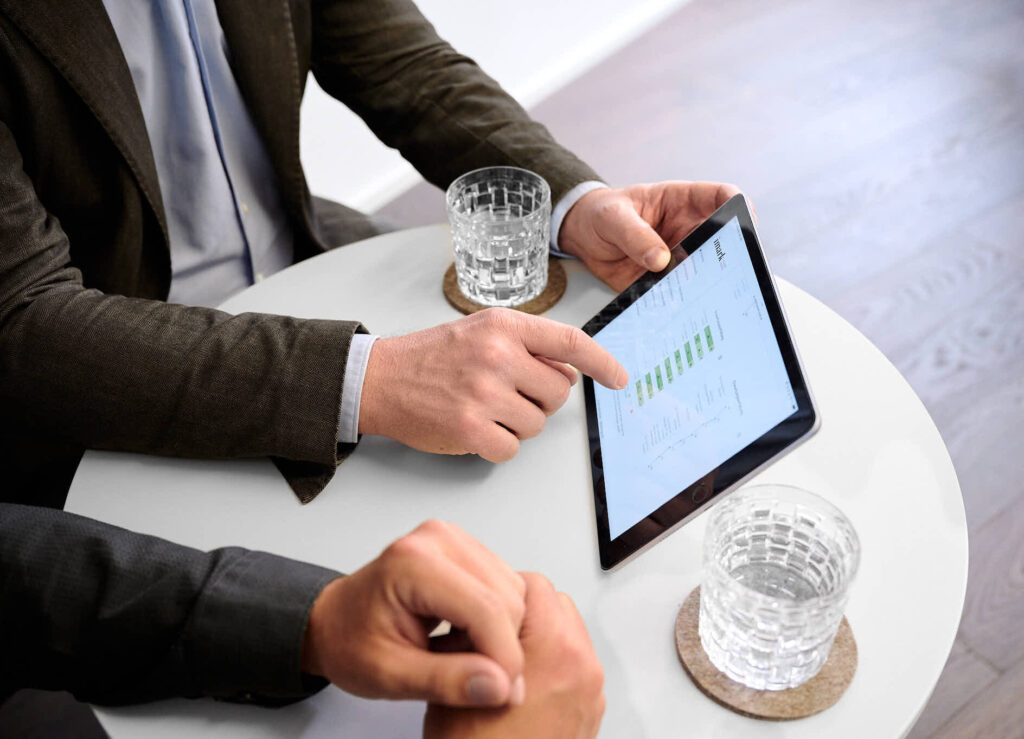
Ein Geschäftsmann zeigt auf ein Tablet mit Daten und Diagrammen am Tisch.
06.05.2026

IMARK Insight Viewer

Eine Hand hält ein Smartphone mit Diagrammen vor einem Laptop mit detaillierten Datenanalysen.
08.04.2026

The Answers Data Can Provide

Kleine Menschen arbeiten gemeinsam an großen 3D-Buchstaben, die das Wort BRAND bilden.
24.03.2026

Does Your Company Have a Brand, or Is It a Brand?

Rote Turnschuhe stehen auf Asphalt vor aufgemalten Pfeilen in verschiedene Richtungen und einem Fragezeichen.
23.01.2026

Future Under Uncertainty

Ein Yin-Yang-Symbol auf einer verrosteten und verwitterten hellen Metalloberfläche.
17.11.2025

Should Strategy and Action Be Separated?

Ein junger Wanderer blickt durch ein Fernglas in eine bergige Naturlandschaft.
05.09.2025

OKRs: Effectively Implementing Strategy in Daily Operations

Venn-Diagramm zeigt die Schnittmenge von Menschen, Inhalten und Daten für Strategizing.
01.07.2025

Why we prefer to speak of strategizing and how it links content, people, and data

Ein weißer König liegt umgefallen neben einer schwarzen Dame auf dem Schachbrett.
09.06.2025

Configuring Services: The Search for the Holy Grail

Schwarze Buchstabentafel mit weißem Hashtag STAYTRUE vor einem pinken Hintergrund.
21.04.2025

Value Orientation in Companies

Glänzender Goldbarren mit der Prägung FINE GOLD umgeben von zahlreichen Goldmünzen.
28.02.2025

Brand Strength – Measuring for Measurement’s Sake?

Eine blühende violette Kapmargerite mit blauer Mitte vor schwarzem Hintergrund.
12.02.2025

Employer Branding Means One Thing Above All: Appreciation

Eine Person sitzt am Schreibtisch und arbeitet mit einem Dashboard auf dem Laptop.
31.01.2025

Strategically Planned Use of Scarce Resources
Vier Ansichten von Kühen mit geometrischen Markierungen auf Kopf, Körper, Ohr und Horn.
26.09.2024

From Cattle to Brand and Back Again

Eine grüne Birne und ein rotgelber Apfel liegen vor weißem Hintergrund.
17.07.2024

Of Apples and Oranges …

Mehrere Hände liegen aufeinander als Symbol für Teamarbeit und Zusammenhalt.
26.04.2024

Quality in Quantitative Market Research

Eine Hand kontrolliert die Qualität eines farbigen CMYK-Druckbogens mit einem Fadenzähler.
24.04.2024

Quality in Qualitative Market Research

Zwei Männer in Anzügen stehen vor einem Bildschirm mit dem Wedl Food Report 2024.
29.02.2024

How Austria Eats – Wedl Food Report 2024

Ein Mosaik aus zahlreichen kleinen Bildschirmen zeigt die Gesichter diverser Menschen.
22.12.2023

Representativeness = Quality?

Instrumententafel eines Flugzeugcockpits mit vier zentralen Schubhebeln und analogen Instrumenten.
07.12.2023

Marketing Dashboards: Dos and Don’ts

Modernes Explorer Hotel aus Holz vor verschneiter Bergkulisse unter blauem Himmel.
04.12.2023

Employer Branding: Case Study Explorer Hotels

Zufriedenheitsskala mit drei Smileys und einem Zeiger, der auf das glückliche Gesicht zeigt.
18.10.2023

NPS® Radar: What the Net Promoter Score Truly Reveals About Your Customers

Eine leuchtende Glühbirne schwingt wie ein Pendel über dem Schriftzug Conjoint Analyse.
28.09.2023

Conjoint Analysis: What Truly Matters to Customers – and What They Are Willing to Pay For

Freiluftbett auf einer Holzterrasse mit Panoramablick auf einen See und sonnige Berge.
14.09.2023

Hospitality: Over 12 Years of Fact-Based Strategy Development

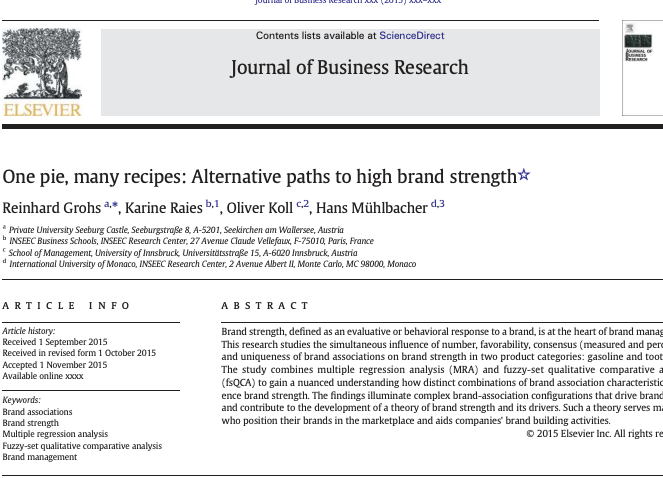
Wissenschaftlicher Artikel aus dem Journal of Business Research zum Thema Markenstärke.
25.07.2023

One pie, many recipes: alternative paths to high brand strength

Vier goldene Sterne auf einer dunklen Hotel-Klassifizierungsplakette aus Metall.
17.05.2023

Hotel Brand Monitoring: What Sets Strong Hotel Brands Apart

Bunt dekoriertes Kunstobjekt mit Zimtstange, Kussmund, goldenen Kugeln und Edelsteinen auf weißem Hintergrund.
20.03.2023

Multi-Sensory Sculpting®

Eine Hand zeichnet eine Glühbirne aus bunten Marketing-Begriffen auf weißem Papier.
08.03.2023

Market Intelligence in Austrian Companies

Verschiedene Eissorten am Stiel und in Waffeln liegen nebeneinander auf blauen Holzbrettern.
09.01.2023

What Does Your Brand Truly Stand For? Insights into the World of Brand Associations

Eine Hand hält eine blaue Debitkarte für eine kontaktlose Bezahlung.
24.11.2022

Price Premium: How much more is your brand worth to your customers?

Zwei Männerhände greifen beim Armdrücken vor einer Holzwand fest ineinander.
12.10.2022

Strong Brand

Detaillierte Nahaufnahme metallischer Bauteile, Zahnräder und Ventilblöcke eines zerlegten Fahrzeuggetriebes.
24.08.2022

Brand Management in Industrial Goods Markets

Viele Menschen bilden aus der Vogelperspektive die Form von Inseln auf weißem Hintergrund.
06.07.2022

Segmentation in Practice: What 50 Decision-Makers Really Say

Zwei bunte Handabdrücke in Rot und Violett auf weißem Hintergrund.
06.04.2022

Investment in Brand Touchpoints – What’s Worthwhile and What Isn’t?

Ein roter Dartpfeil steckt direkt im Bullseye einer Dartscheibe.
16.02.2022

Positioning Decision

) 10. angeordnet (10) 11. sind. (11) Total: 11 words. (Fits 5-15 requirement). Does
11.01.2022

Segmentation: Assessing Segment Attractiveness

Gemischte bunte Schokoladenlinsen werden mit Pfeilen nach ihren Farben Rot, Grün und Gelb sortiert.
24.11.2021

Introduction to Segmentation

Wissenschaftlicher Artikel über die Stabilität von Markenassoziationen von Oliver Koll und Maria Kreuzer.
28.10.2021

Stability of Brand Associations