Skip to content
Insights / Market Research

Representativeness = Quality?

What Does Representativeness Mean
and How Does It Influence Quality
in Market Research?

Zahlreiche kleine Bildschirme mit Porträts verschiedener Menschen sind in einem perspektivischen Raster angeordnet.

In 1994, Der Spiegel reported on irregularities in the market research industry – dubious figures from carelessly obtained survey results.

Even then, there were calls for stricter quality controls and more diligent work. In the following 25 years, little seems to have changed. For several months now, Der Spiegel has been continuously reporting on questionable practices in the market research industry under the heading “The Market Research File” (e.g., data from never-conducted interviews, falsified results, fake samples, etc.).

At the same time, German market research institutes are engaging in media debates about methodological approaches and their statistical quality.

For example, the startup Civey claims to have found a completely new approach in market research. It presents its own results as representative, even if the underlying sample is not representative.

Since then, the topic of quality, and particularly representativeness, has moved strongly into the focus of discussion in relevant media.

In the context of quantitative market research, the term “representativeness” is very often cited as the central quality criterion. However, representativeness is, of course, no guarantee for the validity of market research results. Many other components influence this much more significantly. The focus on representativeness is far too narrow.

What Does "Representativeness" Mean?

“Representativeness” is a topic in market research primarily because it is rarely practical to collect information from all members of the population. Therefore, a subset of this population (the sample) is used, which is hoped to “represent” the population as accurately as possible.

It is often suggested that the process by which a sample is selected influences representativeness. A random sample is frequently cited as the ideal. This is a misunderstanding. A random sample can (by its very definition) also produce highly unrepresentative samples. For example, a sample might consist of 100 women, even though the population contains an equal number of men and women. Or the sample consists of 100 people from Vorarlberg, even though the population includes all Austrians.

The main advantage of a random sample is that the distribution of the sampling error can be calculated, thereby increasing confidence in the precision of an estimate. A sample does not become representative through random selection, although a larger sample reduces the probable estimation error. However, representativeness is also unlikely with other selection methods, as this would ultimately mean that the sample exactly matches the population in all characteristics of interest.

Representativeness Does Not Exist – Or Does It?

A population can be characterized by a multitude of features. However, in a finite sample, it is impossible for all these feature distributions to be equally represented. And even if they were, we wouldn’t know it: many of the characteristics of interest are unknown, and this lack of knowledge is precisely what necessitates the study.

Therefore, representativeness can only be demanded (and verified) for those characteristics that are observable in the sample and known for the overall population, such as gender, age, place of residence, or education. Quota samples ensure representativeness regarding these aspects but must, of course, be viewed just as critically, because the “correct” quotas are not known in advance. Especially for the characteristics underlying the study objective (e.g., attitudes towards new products, brand awareness), the distributions are unknown.

Even online surveys that rely on registered online samples can only ensure representativeness for those factors where the distribution in the population and the characteristic of each survey participant are known. These can then be specifically selected or weighted. Of course, online samples do not contain all conceivable groups of the total population, such as people who do not use the internet or who have not registered as potential respondents. If one of these factors shows a systematic correlation with the characteristic to be investigated (e.g., internet users are positively disposed towards a certain brand), then sample representativeness is unlikely.

When a results report refers to representative samples or representativeness, the sample type and size, the collection method, the weighting procedure, and the exact question with response categories should also be specified. This allows anyone reviewing the results to form their own judgment on whether and how representative the results are.

Are Representative Quantitative Studies Wishful Thinking?

This question cannot be answered with a general yes or no, but three aspects must be clarified between the client and the executing agency within the framework of market research projects:

1

Jointly define the relevant population clearly (e.g., general population aged 20 to 65, or more specifically, all individuals between 30 and 50 years old who have a particular interest in a certain product category and have purchased products from this category at least once in the last year). Without clarity about the population, no approach can be designed that even approximately considers the issue of representativeness.

2

Jointly clarify what role representativeness truly plays: Is the client actually concerned with representativeness, or with the precision and confidence in the results? In the latter case, (only) a random sample allows for the determination of the confidence interval, which becomes smaller (i.e., more precise) with a larger sample.

3

Clarity must be achieved together regarding the best channel to reach the target group (e.g., online, offline, or a combination thereof). In certain cases, it makes sense to approach participants via social networks or online panels. In all these cases (and this applies to a large proportion of studies in practice), one is far from a random sample and only representative by chance (with regard to the characteristics to be investigated).

Services

Customer & Market Analysis Produkt Analysis Employee Satisfaction Brand Analysis & Monitoring
Services Overview

Lächelnder Mann mit Brille und Dreitagebart blickt freundlich direkt in die Kamera.
From Mag. Christoph Antretter 22.12.2023

Articles You Might Be Interested In

All Articles
13.10.2026

25 Years of IMARK – We Celebrated!

Dreidimensionaler Schriftzug Employer Branding als Würfel gestaltet mit kleinen roten Silhouetten.
05.09.2026

The Employer Brand in Daily Operations

Nahaufnahme eines Autoreifens auf einer sonnenbeschienenen Asphaltstraße bei Sonnenuntergang.
04.09.2026

SWARCO: From Corporate Brand to a Living Employer Brand

Modernes Explorer Hotel mit Holzfassade und grünen Akzenten vor einer bewaldeten Bergkulisse.
10.08.2026

Brand as a Management Tool – The Success Model of the Explorer Hotels

Farbenfroher Pixel-Art-Schriftzug BRAND OVER? vor einer klassischen Retro-Videospiel-Landschaft.
12.06.2026

Brand Over?

Ein Geschäftsmann zeigt auf ein Tablet mit Daten und Diagrammen am Tisch.
06.05.2026

IMARK Insight Viewer

Eine Hand hält ein Smartphone mit Diagrammen vor einem Laptop mit detaillierten Datenanalysen.
08.04.2026

The Answers Data Can Provide

Kleine Menschen arbeiten gemeinsam an großen 3D-Buchstaben, die das Wort BRAND bilden.
24.03.2026

Does Your Company Have a Brand, or Is It a Brand?

Rote Turnschuhe stehen auf Asphalt vor aufgemalten Pfeilen in verschiedene Richtungen und einem Fragezeichen.
23.01.2026

Future Under Uncertainty

Ein Yin-Yang-Symbol auf einer verrosteten und verwitterten hellen Metalloberfläche.
17.11.2025

Should Strategy and Action Be Separated?

Ein junger Wanderer blickt durch ein Fernglas in eine bergige Naturlandschaft.
05.09.2025

OKRs: Effectively Implementing Strategy in Daily Operations

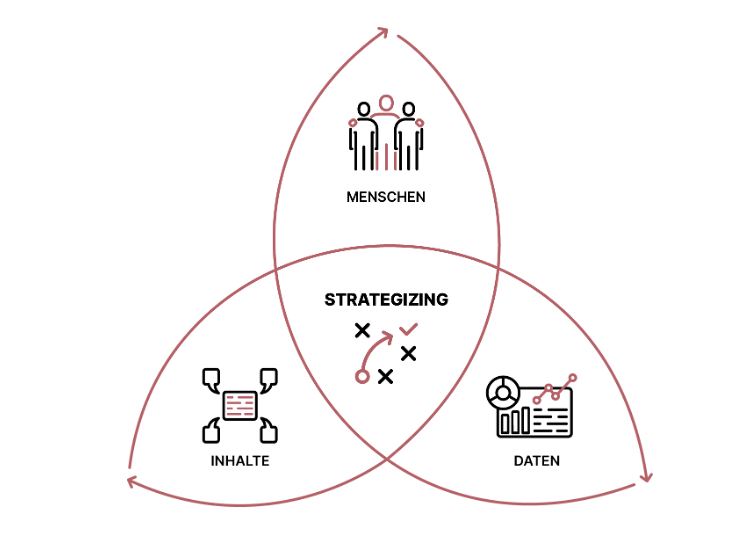
Venn-Diagramm zeigt die Schnittmenge von Menschen, Inhalten und Daten für Strategizing.
01.07.2025

Why we prefer to speak of strategizing and how it links content, people, and data

Ein weißer König liegt umgefallen neben einer schwarzen Dame auf dem Schachbrett.
09.06.2025

Configuring Services: The Search for the Holy Grail

Schwarze Buchstabentafel mit weißem Hashtag STAYTRUE vor einem pinken Hintergrund.
21.04.2025

Value Orientation in Companies

Glänzender Goldbarren mit der Prägung FINE GOLD umgeben von zahlreichen Goldmünzen.
28.02.2025

Brand Strength – Measuring for Measurement’s Sake?

Eine blühende violette Kapmargerite mit blauer Mitte vor schwarzem Hintergrund.
12.02.2025

Employer Branding Means One Thing Above All: Appreciation

Eine Person sitzt am Schreibtisch und arbeitet mit einem Dashboard auf dem Laptop.
31.01.2025

Strategically Planned Use of Scarce Resources

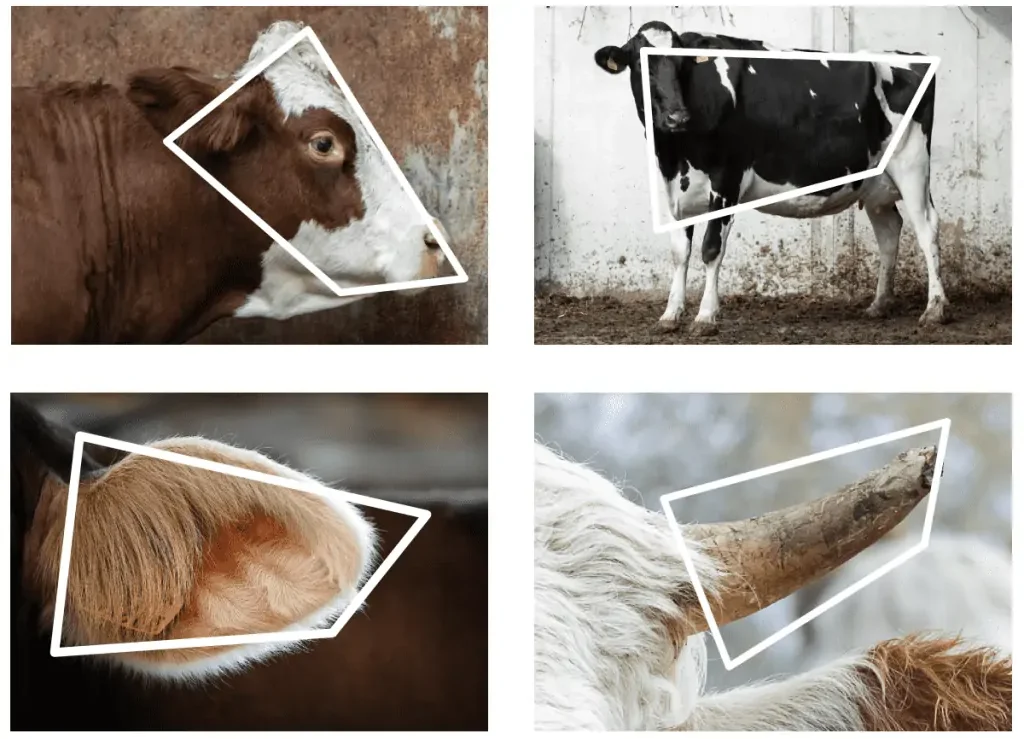
Vier Ansichten von Kühen mit geometrischen Markierungen auf Kopf, Körper, Ohr und Horn.
26.09.2024

From Cattle to Brand and Back Again

Eine grüne Birne und ein rotgelber Apfel liegen vor weißem Hintergrund.
17.07.2024

Of Apples and Oranges …


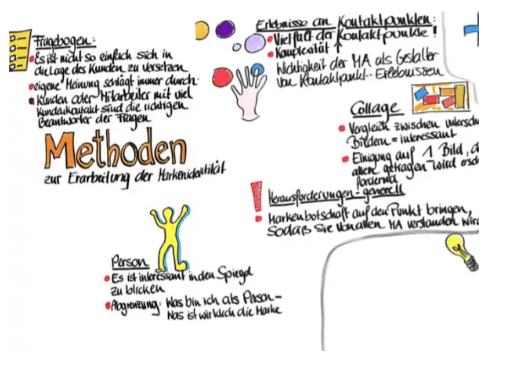
Handgezeichnete Sketchnote zu Methoden der Markenidentität mit Texten und kleinen bunten Illustrationen.
10.05.2024

Understanding Through Seeing

Mehrere Hände liegen aufeinander als Symbol für Teamarbeit und Zusammenhalt.
26.04.2024

Quality in Quantitative Market Research

Eine Hand kontrolliert die Qualität eines farbigen CMYK-Druckbogens mit einem Fadenzähler.
24.04.2024

Quality in Qualitative Market Research

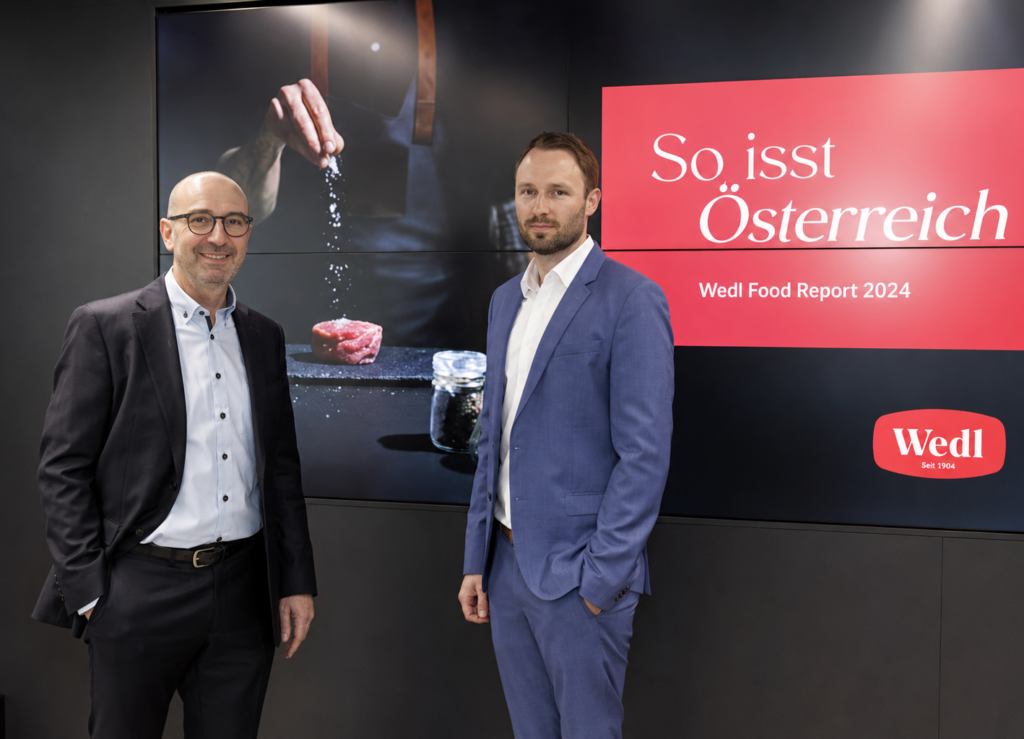
Zwei Männer in Anzügen stehen vor einem Bildschirm mit dem Wedl Food Report 2024.
29.02.2024

How Austria Eats – Wedl Food Report 2024

Instrumententafel eines Flugzeugcockpits mit vier zentralen Schubhebeln und analogen Instrumenten.
07.12.2023

Marketing Dashboards: Dos and Don’ts

Modernes Explorer Hotel aus Holz vor verschneiter Bergkulisse unter blauem Himmel.
04.12.2023

Employer Branding: Case Study Explorer Hotels

Zufriedenheitsskala mit drei Smileys und einem Zeiger, der auf das glückliche Gesicht zeigt.
18.10.2023

NPS® Radar: What the Net Promoter Score Truly Reveals About Your Customers

Eine leuchtende Glühbirne schwingt wie ein Pendel über dem Schriftzug Conjoint Analyse.
28.09.2023

Conjoint Analysis: What Truly Matters to Customers – and What They Are Willing to Pay For

Freiluftbett auf einer Holzterrasse mit Panoramablick auf einen See und sonnige Berge.
14.09.2023

Hospitality: Over 12 Years of Fact-Based Strategy Development

Wissenschaftlicher Artikel aus dem Journal of Business Research zum Thema Markenstärke.
25.07.2023

One pie, many recipes: alternative paths to high brand strength

Vier goldene Sterne auf einer dunklen Hotel-Klassifizierungsplakette aus Metall.
17.05.2023

Hotel Brand Monitoring: What Sets Strong Hotel Brands Apart

Bunt dekoriertes Kunstobjekt mit Zimtstange, Kussmund, goldenen Kugeln und Edelsteinen auf weißem Hintergrund.
20.03.2023

Multi-Sensory Sculpting®

Eine Hand zeichnet eine Glühbirne aus bunten Marketing-Begriffen auf weißem Papier.
08.03.2023

Market Intelligence in Austrian Companies

Verschiedene Eissorten am Stiel und in Waffeln liegen nebeneinander auf blauen Holzbrettern.
09.01.2023

What Does Your Brand Truly Stand For? Insights into the World of Brand Associations

Eine Hand hält eine blaue Debitkarte für eine kontaktlose Bezahlung.
24.11.2022

Price Premium: How much more is your brand worth to your customers?

Zwei Männerhände greifen beim Armdrücken vor einer Holzwand fest ineinander.
12.10.2022

Strong Brand

Detaillierte Nahaufnahme metallischer Bauteile, Zahnräder und Ventilblöcke eines zerlegten Fahrzeuggetriebes.
24.08.2022

Brand Management in Industrial Goods Markets

Viele Menschen bilden aus der Vogelperspektive die Form von Inseln auf weißem Hintergrund.
06.07.2022

Segmentation in Practice: What 50 Decision-Makers Really Say

Zwei bunte Handabdrücke in Rot und Violett auf weißem Hintergrund.
06.04.2022

Investment in Brand Touchpoints – What’s Worthwhile and What Isn’t?

Ein roter Dartpfeil steckt direkt im Bullseye einer Dartscheibe.
16.02.2022

Positioning Decision

) 10. angeordnet (10) 11. sind. (11) Total: 11 words. (Fits 5-15 requirement). Does
11.01.2022

Segmentation: Assessing Segment Attractiveness

Gemischte bunte Schokoladenlinsen werden mit Pfeilen nach ihren Farben Rot, Grün und Gelb sortiert.
24.11.2021

Introduction to Segmentation

Wissenschaftlicher Artikel über die Stabilität von Markenassoziationen von Oliver Koll und Maria Kreuzer.
28.10.2021

Stability of Brand Associations